


EDITOR’S NOTE: All data sets references, explanations and wonky stuff is located at the bottom of this artice.
There’s been a palpable push post-COVID in Georgia to increase teacher pay.
Much of it stems from teacher retention, or a lack thereof. There’s also an inflow/outflow problem. Basically, the number of Peach State teachers retiring each year is far outpacing the number of first-year teachers. Many school systems in Georgia, especially the smaller and more rural ones, are having a hard time finding enough certified teachers to fill out their ranks.
Different experts have different theories about why more young people arent getting into teaching. What’s not debatable, however, is that it’s a huge headache for the Georgia Deparetment of Education and local superintendents.
Gov. Brian Kemp responded by authorizing two payraises for public school teachers in as many months. The governor last December announced that all teachers would be receiving a $1,000 bonus, and the very next month he announced a $2,500 increase per teacher in the state’s next fiscal year budget.
Below is a ranked list of teacher pay in Georgia on a county-by-county basis. The data is from the 2021-2022 school year, but it still offers plenty of insight. The top 30 is domnated by metro Atlanta school sdistrict and north Georgia mountain county school districts. The small mountain counties have a really outsized presence in the top 30.
Basically, the further south you go and further away from the mountains you go, the less money a teacher is likely to make. Not surprigingly, the bottom 25 school districts on the list are majority south Georgia counties.
Also included in the list below is each county school district’s “average years of teacher experience,” as well as “percent of teachers with advanced degrees.” To a lesser extent, there’s a positive correlation between school districts with higher pay and school districts with a higher percentage of teachers with advanced degrees. It’s not a strong correlation, however. Essentially, teacher pay is mainly based on how much different school boards in different counties are willing to pay.
Here’s the complete list, 1–159…

- COBB // $82,698.00
- Avg. years of experience: 14
- Percent with advanced degrees: 67.7%
- PAULDING // $67,515.00
- Avg. years of experience: 14
- Percent with advanced degrees: 65.8%
- HOUSTON // $67,108.00
- Avg. years of experience: 14
- Percent with advanced degrees: 70.0%
- FAYETTE // $66,663.00
- Avg. years of experience: 17
- Percent with advanced degrees: 76.1%
- DEKALB // $66,429.00
- Avg. years of experience: 14
- Percent with advanced degrees: 67.6%
- CHEROKEE // $65,785.00
- Avg. years of experience: 14
- Percent with advanced degrees: 67.3%
- DAWSON // $65,380.00
- Avg. years of experience: 16
- Percent with advanced degrees: 65.7%
- GWINNETT // $65,369.00
- Avg. years of experience: 13
- Percent with advanced degrees: 66.7%
- WALTON // $65,227.00
- Avg. years of experience: 17
- Percent with advanced degrees: 76.3%
- OCONEE // $64,407.00
- Avg. years of experience: 16
- Percent with advanced degrees: 78.3%
- BURKE // $64,384.00
- Avg. years of experience: 14
- Percent with advanced degrees: 68.9%
- FULTON // $64,187.00
- Avg. years of experience: 12
- Percent with advanced degrees: 61.7%
- COLUMBIA // $63,638.00
- Avg. years of experience: 14
- Percent with advanced degrees: 72.2%
- COWETA // $63,573.00
- Avg. years of experience: 15
- Percent with advanced degrees: 68.4%
- FORSYTH // $63,455.00
- Avg. years of experience: 15
- Percent with advanced degrees: 64.5%
- UNION // $63,202.00
- Avg. years of experience: 17
- Percent with advanced degrees: 77.6%
- GILMER // $62,845.00
- Avg. years of experience: 14
- Percent with advanced degrees: 69.7%
- PICKENS // $62,838.00
- Avg. years of experience: 16
- Percent with advanced degrees: 72.0%
- BARTOW // $62,445.00
- Avg. years of experience: 14
- Percent with advanced degrees: 59.4%
- LUMPKIN // $61,894.00
- Avg. years of experience: 14
- Percent with advanced degrees: 67.7%
- MONROE // $61,859.00
- Avg. years of experience: 15
- Percent with advanced degrees: 72.5%
- HARRIS // $61,285.00
- Avg. years of experience: 16
- Percent with advanced degrees: 65.5%
- SCHLEY // $61,278.00
- Avg. years of experience: 17
- Percent with advanced degrees: 75.8%
- FANNIN // $61,118.00
- Avg. years of experience: 15
- Percent with advanced degrees: 69.3%
- JACKSON // $60,905.00
- Avg. years of experience: 13
- Percent with advanced degrees: 70.1%
- BANKS // $60,852.00
- Avg. years of experience: 15
- Percent with advanced degrees: 67.6%
- LAURENS // $60,802.00
- Avg. years of experience: 16
- Percent with advanced degrees: 73.7%
- RABUN // $60,800.00
- Avg. years of experience: 15
- Percent with advanced degrees: 68.9%
- MADISON // $60,797.00
- Avg. years of experience: 15
- Percent with advanced degrees: 72.8%
- MURRAY // $60,742.00
- Avg. years of experience: 14
- Percent with advanced degrees: 66.7%
- CLAYTON // $60,661.00
- Avg. years of experience: 12
- Percent with advanced degrees: 62.7%
- BRYAN // $60,626.00
- Avg. years of experience: 14
- Percent with advanced degrees: 62.7%
- MORGAN // $60,605.00
- Avg. years of experience: 16
- Percent with advanced degrees: 79.1%
- WHITE // $60,544.00
- Avg. years of experience: 15
- Percent with advanced degrees: 73.0%
- POLK // $60,413.00
- Avg. years of experience: 15
- Percent with advanced degrees: 58.6%
- HALL // $60,389.00
- Avg. years of experience: 14
- Percent with advanced degrees: 63.9%
- EFFINGHAM // $60,250.00
- Avg. years of experience: 14
- Percent with advanced degrees: 63.0%
- WHITFIELD // $60,108.00
- Avg. years of experience: 14
- Percent with advanced degrees: 68.0%
- CAMDEN // $59,972.00
- Avg. years of experience: 16
- Percent with advanced degrees: 65.9%
- HART // $59,941.00
- Avg. years of experience: 15
- Percent with advanced degrees: 72.8%
- HABERSHAM // $59,898.00
- Avg. years of experience: 15
- Percent with advanced degrees: 71.5%
- PIKE // $59,795.00
- Avg. years of experience: 17
- Percent with advanced degrees: 63.6%
- TOWNS // $59,762.00
- Avg. years of experience: 15
- Percent with advanced degrees: 71.8%
- HEARD // $59,723.00
- Avg. years of experience: 15
- Percent with advanced degrees: 67.3%
- GLYNN // $59,667.00
- Avg. years of experience: 15
- Percent with advanced degrees: 67.3%
- WASHINGTON // $59,611.00
- Avg. years of experience: 15
- Percent with advanced degrees: 69.2%
- CHARLTON // $59,487.00
- Avg. years of experience: 16
- Percent with advanced degrees: 65.5%
- WEBSTER // $59,463.00
- Avg. years of experience: 19
- Percent with advanced degrees: 73.9%
- ROCKDALE // $59,432.00
- Avg. years of experience: 14
- Percent with advanced degrees: 64.3%
- NEWTON // $59,419.00
- Avg. years of experience: 13
- Percent with advanced degrees: 64.3%
- PUTNAM // $59,366.00
- Avg. years of experience: 14
- Percent with advanced degrees: 65.2%
- FLOYD // $59,286.00
- Avg. years of experience: 16
- Percent with advanced degrees: 68.0%
- WILCOX // $59,259.00
- Avg. years of experience: 19
- Percent with advanced degrees: 75.3%
- LINCOLN // $59,222.00
- Avg. years of experience: 16
- Percent with advanced degrees: 68.1%
- IRWIN // $59,216.00
- Avg. years of experience: 14
- Percent with advanced degrees: 65.7%
- HARALSON // $59,188.00
- Avg. years of experience: 16
- Percent with advanced degrees: 63.5%
- JENKINS // $59,145.00
- Avg. years of experience: 18
- Percent with advanced degrees: 69.8%
- TELFAIR // $59,108.00
- Avg. years of experience: 16
- Percent with advanced degrees: 63.9%
- BEN HILL // $58,987.00
- Avg. years of experience: 15
- Percent with advanced degrees: 62.7%
- FRANKLIN // $58,971.00
- Avg. years of experience: 15
- Percent with advanced degrees: 69.1%

- GORDON // $58,948.00
- Avg. years of experience: 14
- Percent with advanced degrees: 57.6%
- TREUTLEN // $58,916.00
- Avg. years of experience: 16
- Percent with advanced degrees: 69.8%
- PIERCE // $58,807.00
- Avg. years of experience: 17
- Percent with advanced degrees: 72.6%
- BUTTS // $58,769.00
- Avg. years of experience: 14
- Percent with advanced degrees: 60.8%
- TAYLOR // $58,722.00
- Avg. years of experience: 16
- Percent with advanced degrees: 66.1%
- GREENE // $58,614.00
- Avg. years of experience: 14
- Percent with advanced degrees: 65.0%
- CHATHAM // $58,590.00
- Avg. years of experience: 12
- Percent with advanced degrees: 61.1%
- APPLING // $58,528.00
- Avg. years of experience: 14
- Percent with advanced degrees: 59.4%
- ELBERT // $58,365.00
- Avg. years of experience: 14
- Percent with advanced degrees: 67.7%
- JASPER // $58,343.00
- Avg. years of experience: 16
- Percent with advanced degrees: 63.7%
- CARROLL // $58,180.00
- Avg. years of experience: 14
- Percent with advanced degrees: 61.4%
- THOMAS // $58,128.00
- Avg. years of experience: 15
- Percent with advanced degrees: 59.0%
- CATOOSA // $58,050.00
- Avg. years of experience: 16
- Percent with advanced degrees: 67.6%
- CRISP // $58,043.00
- Avg. years of experience: 14
- Percent with advanced degrees: 59.6%
- BULLOCH // $58,026.00
- Avg. years of experience: 15
- Percent with advanced degrees: 60.3%
- HENRY // $58,000.00
- Avg. years of experience: 12
- Percent with advanced degrees: 60.9%
- BLECKLEY // $57,972.00
- Avg. years of experience: 16
- Percent with advanced degrees: 68.6%
- DADE // $57,907.00
- Avg. years of experience: 16
- Percent with advanced degrees: 65.8%
- JONES // $57,888.00
- Avg. years of experience: 16
- Percent with advanced degrees: 60.8%
- PEACH // $57,875.00
- Avg. years of experience: 16
- Percent with advanced degrees: 58.4%
- UPSON // $57,855.00
- Avg. years of experience: 13
- Percent with advanced degrees: 58.3%
- OGLETHORPE // $57,744.00
- Avg. years of experience: 15
- Percent with advanced degrees: 71.4%
- CHATTOOGA // $57,679.00
- Avg. years of experience: 16
- Percent with advanced degrees: 62.1%
- SEMINOLE // $57,476.00
- Avg. years of experience: 17
- Percent with advanced degrees: 60.8%
- LEE // $57,440.00
- Avg. years of experience: 15
- Percent with advanced degrees: 67.1%
- TROUP // $57,383.00
- Avg. years of experience: 15
- Percent with advanced degrees: 68.0%
- GLASCOCK // $57,255.00
- Avg. years of experience: 16
- Percent with advanced degrees: 62.2%
- LOWNDES // $57,234.00
- Avg. years of experience: 15
- Percent with advanced degrees: 64.9%
- LAMAR // $57,083.00
- Avg. years of experience: 14
- Percent with advanced degrees: 58.3%
- CHATTAHOOCHEE // $57,053.00
- Avg. years of experience: 13
- Percent with advanced degrees: 60.3%

- COLQUITT // $57,006.00
- Avg. years of experience: 15
- Percent with advanced degrees: 61.9%
- DECATUR // $56,941.00
- Average years of experience: 16
- Percent with advanced degrees: 64.5%
- WHEELER // $56,912.00
- Average years of experience: 16
- Percent with advanced degrees: 57.4%
- DODGE // $56,596.00
- Average years of experience: 14
- Percent with advanced degrees: 66.0%
- CLINCH // $56,506.00
- Average years of experience: 15
- Percent with advanced degrees: 63.6%
- CRAWFORD // $56,500.00
- Average years of experience: 15
- Percent with advanced degrees: 54.2%
- MARION // $56,441.00
- Average years of experience: 14
- Percent with advanced degrees: 59.8%
- EMANUEL // $56,407.00
- Average years of experience: 15
- Percent with advanced degrees: 61.7%
- BRANTLEY // $56,393.00
- Average years of experience: 15
- Percent with advanced degrees: 61.0%
- WARE // $56,346.00
- Average years of experience: 14
- Percent with advanced degrees: 59.0%
- TALIAFERRO // $56,345.00
- Average years of experience: 14
- Percent with advanced degrees: 68.2%
- HANCOCK // $56,329.00
- Average years of experience: 16
- Percent with advanced degrees: 65.9%
- BALDWIN // $56,326.00
- Average years of experience: 14
- Percent with advanced degrees: 67.0%
- CLARKE // $56,302.00
- Average years of experience: 11
- Percent with advanced degrees: 65.4%
- ATKINSON // $56,282.00
- Average years of experience: 14
- Percent with advanced degrees: 66.4%
- TERRELL // $56,220.00
- Average years of experience: 17
- Percent with advanced degrees: 63.1%
- TIFT // $56,162.00
- Average years of experience: 13
- Percent with advanced degrees: 55.9%
- STEWART // $56,143.00
- Average years of experience: 15
- Percent with advanced degrees: 65.9%
- JOHNSON // $56,053.00
- Average years of experience: 15
- Percent with advanced degrees: 56.3%
- SPALDING // $56,000.00
- Average years of experience: 12
- Percent with advanced degrees: 57.3%
- TALBOT // $55,979.00
- Average years of experience: 19
- Percent with advanced degrees: 75.0%
- MCINTOSH // $55,935.00
- Average years of experience: 14
- Percent with advanced degrees: 63.5%
- SUMTER // $55,931.00
- Average years of experience: 13
- Percent with advanced degrees: 63.0%
- MUSCOGEE // $55,872.00
- Average years of experience: 12
- Percent with advanced degrees: 59.2%
- STEPHENS // $55,872.00
- Average years of experience: 15
- Percent with advanced degrees: 63.5%
- TURNER // $55,872.00
- Average years of experience: 12
- Percent with advanced degrees: 57.6%
- WORTH // $55,768.00
- Average years of experience: 15
- Percent with advanced degrees: 64.6%
- MITCHELL // $55,738.00
- Average years of experience: 13
- Percent with advanced degrees: 60.5%
- BERRIEN // $55,720.00
- Average years of experience: 15
- Percent with advanced degrees: 65.0%
- BIBB // $55,319.00
- Average years of experience: 11
- Percent with advanced degrees: 55.3%
- COFFEE // $55,304.00
- Average years of experience: 13
- Percent with advanced degrees: 58.6%
- WARREN // $55,037.00
- Average years of experience: 15
- Percent with advanced degrees: 57.1%
- WAYNE // $55,004.00
- Average years of experience: 14
- Percent with advanced degrees: 54.9%
- DOUGHERTY // $54,946.00
- Average years of experience: 14
- Percent with advanced degrees: 57.9%
- GRADY // $54,894.00
- Average years of experience: 14
- Percent with advanced degrees: 54.0%
- COOK // $54,822.00
- Average years of experience: 14
- Percent with advanced degrees: 53.6%
- WALKER // $54,810.00
- Average years of experience: 14
- Percent with advanced degrees: 57.8%
- JEFFERSON // $54,753.00
- Average years of experience: 12
- Percent with advanced degrees: 51.1%
- SCREVEN // $54,671.00
- Average years of experience: 14
- Percent with advanced degrees: 51.2%
- EARLY // $54,604.00
- Average years of experience: 15
- Percent with advanced degrees: 61.4%
- JEFF DAVIS // $54,423.00
- Average years of experience: 16
- Percent with advanced degrees: 57.7%
- TWIGGS // $54,362.00
- Average years of experience: 10
- Percent with advanced degrees: 56.3%
- LIBERTY // $54,118.00
- Average years of experience: 13
- Percent with advanced degrees: 66.3%
- BACON // $54,008.00
- Average years of experience: 16
- Percent with advanced degrees: 62.0%
- MCDUFFIE // $53,854.00
- Average years of experience: 12
- Percent with advanced degrees: 53.0%
- PULASKI // $53,741.00
- Average years of experience: 14
- Percent with advanced degrees: 52.2%
- DOUGLAS // $53,673.00
- Average years of experience: 14
- Percent with advanced degrees: 63.3%
- TOOMBS // $53,638.00
- Average years of experience: 15
- Percent with advanced degrees: 60.9%
- ECHOLS // $53,619.00
- Average years of experience: 14
- Percent with advanced degrees: 54.1%
- WILKES // $53,551.00
- Average years of experience: 15
- Percent with advanced degrees: 54.3%
- TATTNALL // $53,478.00
- Average years of experience: 14
- Percent with advanced degrees: 57.0%
- CANDLER // $53,420.00
- Average years of experience: 13
- Percent with advanced degrees: 55.0%
- RICHMOND // $53,401.00
- Average years of experience: 11
- Percent with advanced degrees: 57.2%
- MILLER // $53,065.00
- Average years of experience: 14
- Percent with advanced degrees: 37.7%
- MONTGOMERY // $52,971.00
- Average years of experience: 15
- Percent with advanced degrees: 47.1%
- CALHOUN // $52,843.00
- Average years of experience: 11
- Percent with advanced degrees: 63.4%
- WILKINSON // $52,752.00
- Average years of experience: 11
- Percent with advanced degrees: 58.5%
- LANIER // $52,716.00
- Average years of experience: 13
- Percent with advanced degrees: 55.9%
- LONG // $52,537.00
- Average years of experience: 10
- Percent with advanced degrees: 61.3%
- BARROW // $52,487.00
- Average years of experience: 13
- Percent with advanced degrees: 62.4%
- RANDOLPH // $52,361.00
- Average years of experience: 11
- Percent with advanced degrees: 66.7%
- MERIWETHER // $52,195.00
- Average years of experience: 12
- Percent with advanced degrees: 51.1%
- DOOLY // $52,023.00
- Average years of experience: 11
- Percent with advanced degrees: 41.7%
- BROOKS // $50,946.00
- Average years of experience: 9
- Percent with advanced degrees: 45.5%
- QUITMAN // $50,418.00
- Average years of experience: 15
- Percent with advanced degrees: 64.0%
- MACON // $50,411.00
- Average years of experience: 10
- Percent with advanced degrees: 41.8%
- EVANS // $49,580.00
- Average years of experience: 9
- Percent with advanced degrees: 46.3%
- BAKER // $49,195.00
- Average years of experience: 15
- Percent with advanced degrees: 50.0%
- CLAY // $46,532
- Average years of experience: 11
- Percent with advanced degrees: 50%
WONKY STUFF: Data courtesy of the Georgia Department of Education (2021-2022 school year)
IMAGE CREDITS: Cover photo – Photo by Amit Lahav on Unsplash; body font photos – ExploreGeorgia.org

RANKED: What are Georgia’s main fruit and vegetable crops (HINT: it’s not peaches)
“The Peanut State” just doesn’t have the marketing and branding prowess
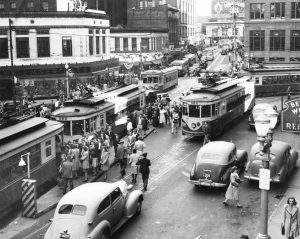
What were the 100 largest Georgia counties in 1940?
Metro Atlanta counties only sparsely populated the top 15 prior to Pearl Harbor

RANKED: What are the top 15 Georgia golf courses that don’t require a membership to play?
Two names on the list reign supreme – Reynolds Lake Oconee and Sea Island.

Which Georgia counties are most trending Hispanic?
South Georgia sees the largest relative gains…

Which county school districts in Georgia pay teachers the most?
The top 30 list dominated by metro Altanta and mountain counties…
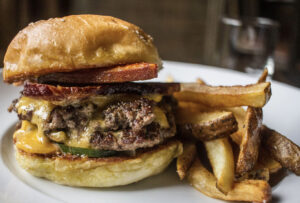
These are the 15 best Macon restaurants, according to the composite rankings
Downtown restaurants dominate the list…